predictive outlook at Ethereum price 2022
December 1, 2021

Hello, I’m Alex Shibu and thanks for reading. This is gonna be my attempt at trying to do technical analysis to beat the market. Being a lover of web3 and even having an NFT project for myself (Circus Clownz), I thought it would be beneficial for both me and you to have a different perspective of the future of crypto, most importantly Ethereum for the upcoming months. Without further ado let’s get into this!
This analysis starts from the first week of January 2021 to the end of the last week of trading available as of November 25, 2021. (Jan 3, 2021 – Nov 23, 2021)
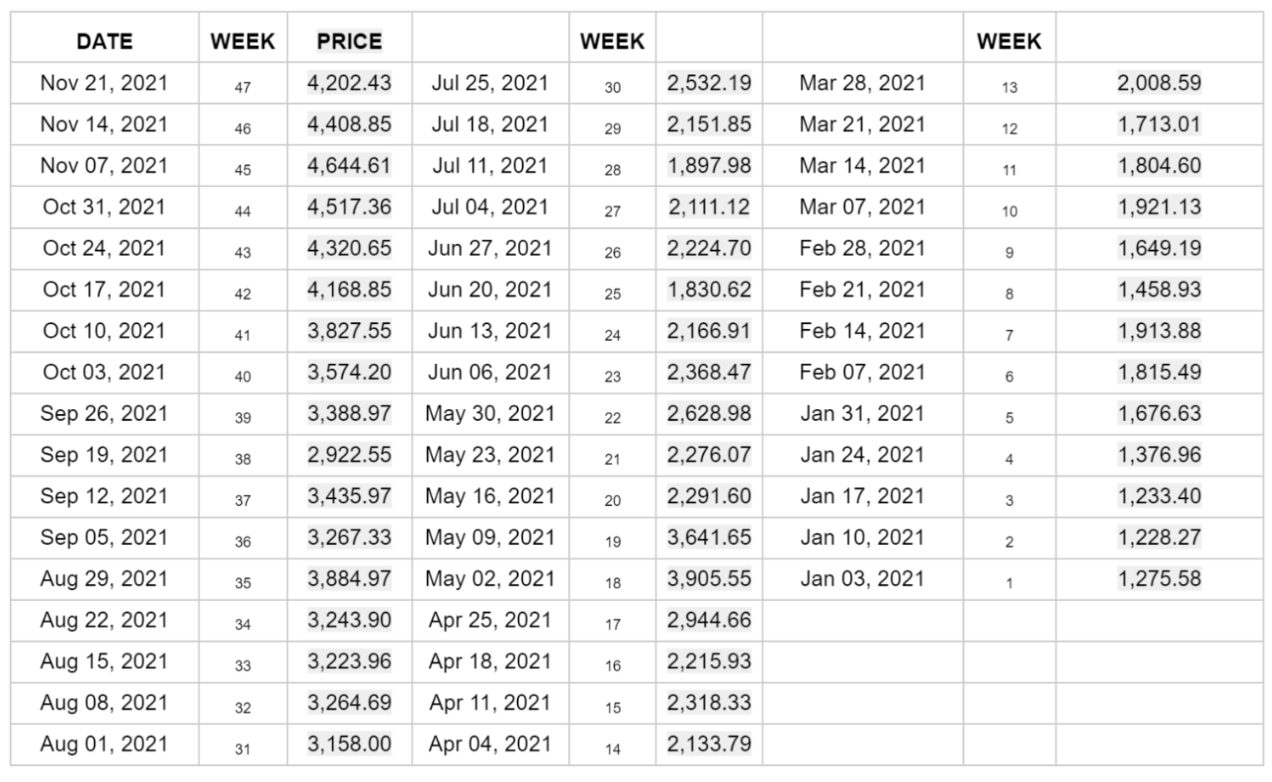
ETHEREUM PRICE VALUES 2021: SHEETS
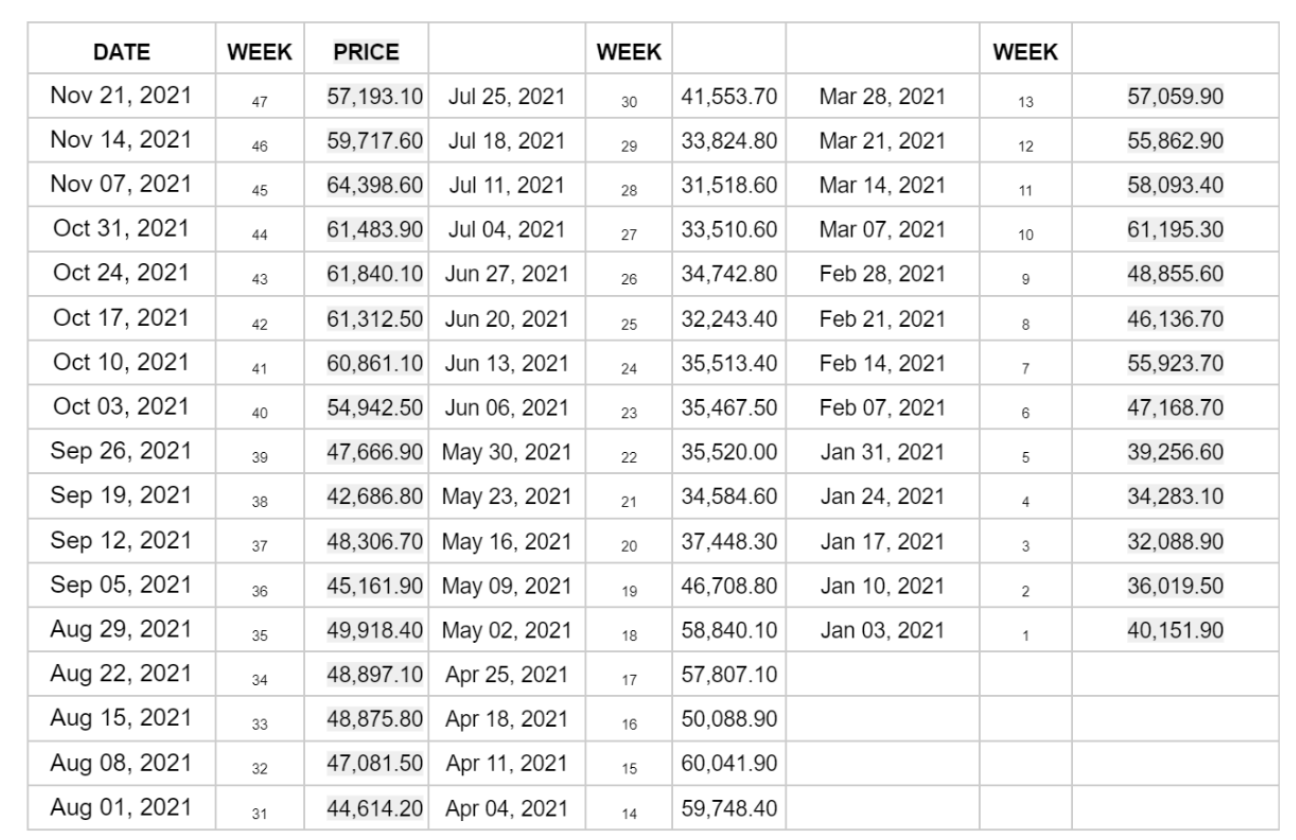
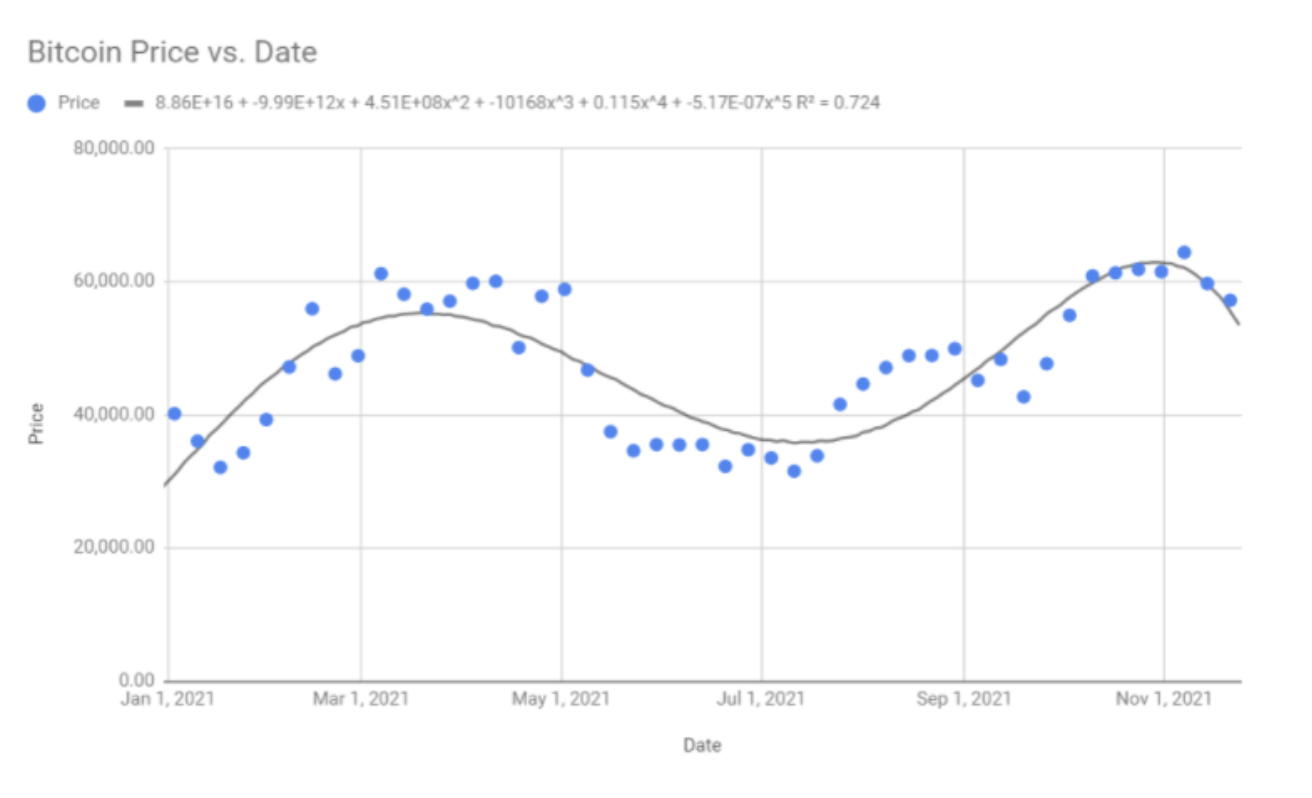
BITCOIN PRICE VALUES 2021: SHEETS
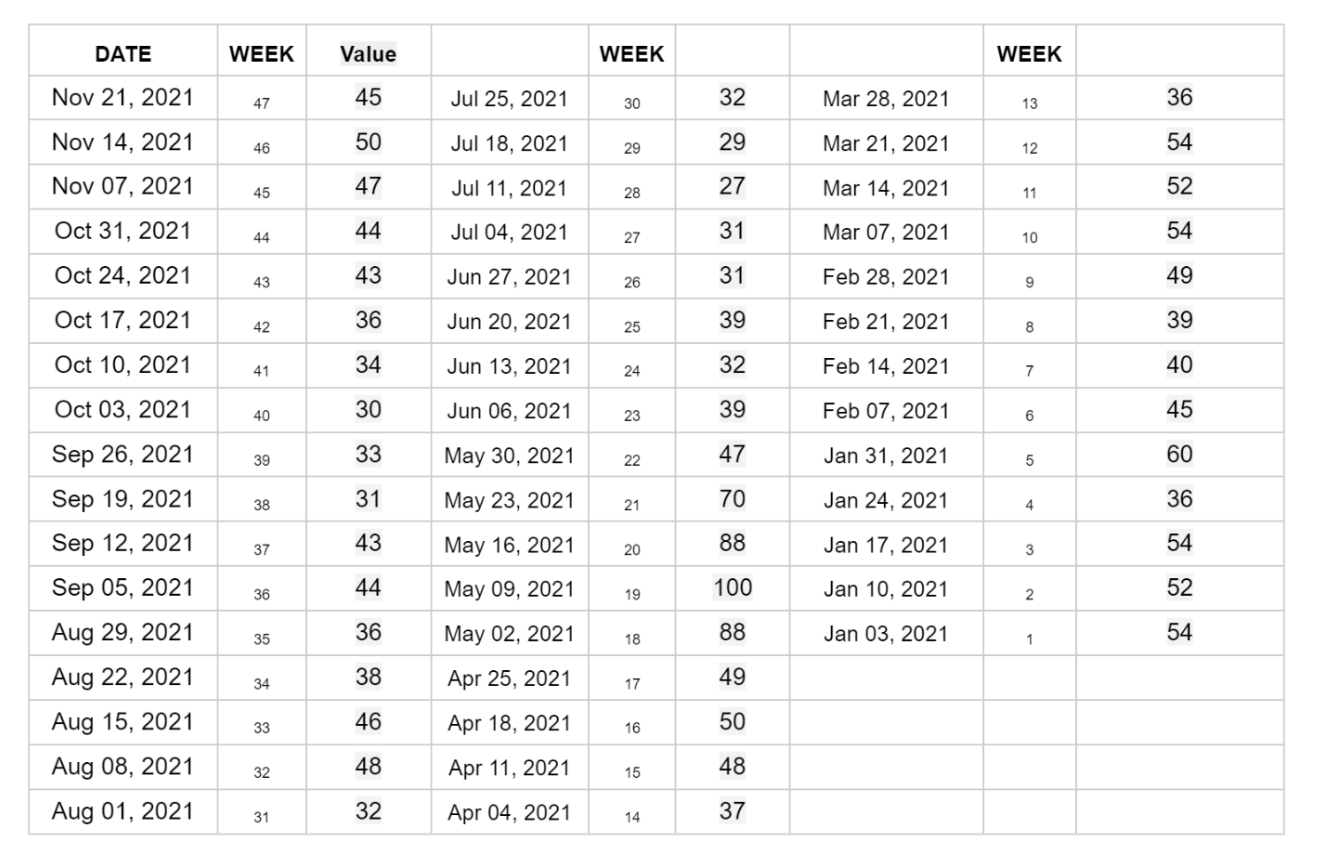
ETHEREUM TREND VALUES: SHEETS
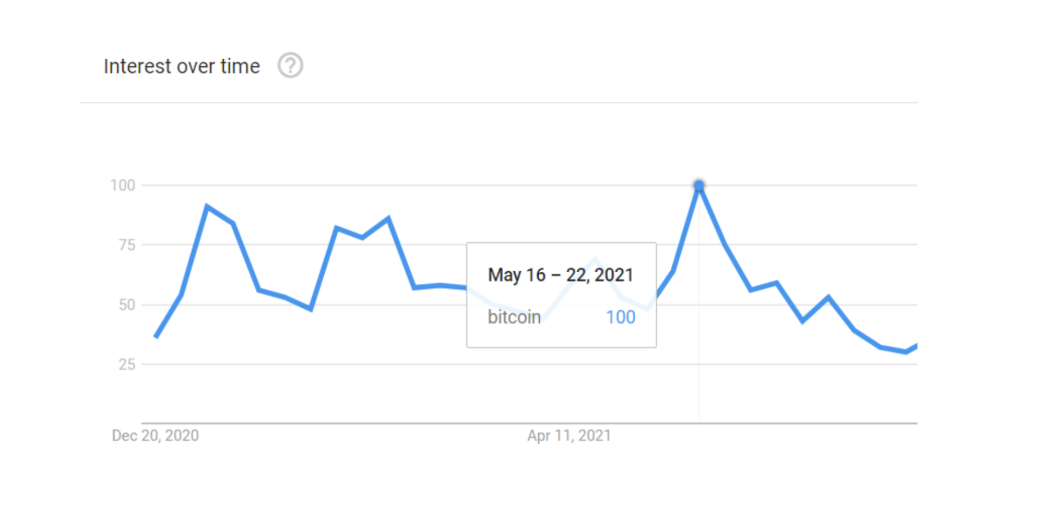
Numbers represent search interest relative to the highest point on the chart for the given region and time. A value of 100 is the peak popularity for the term. A value of 50 means that the term is half as popular.
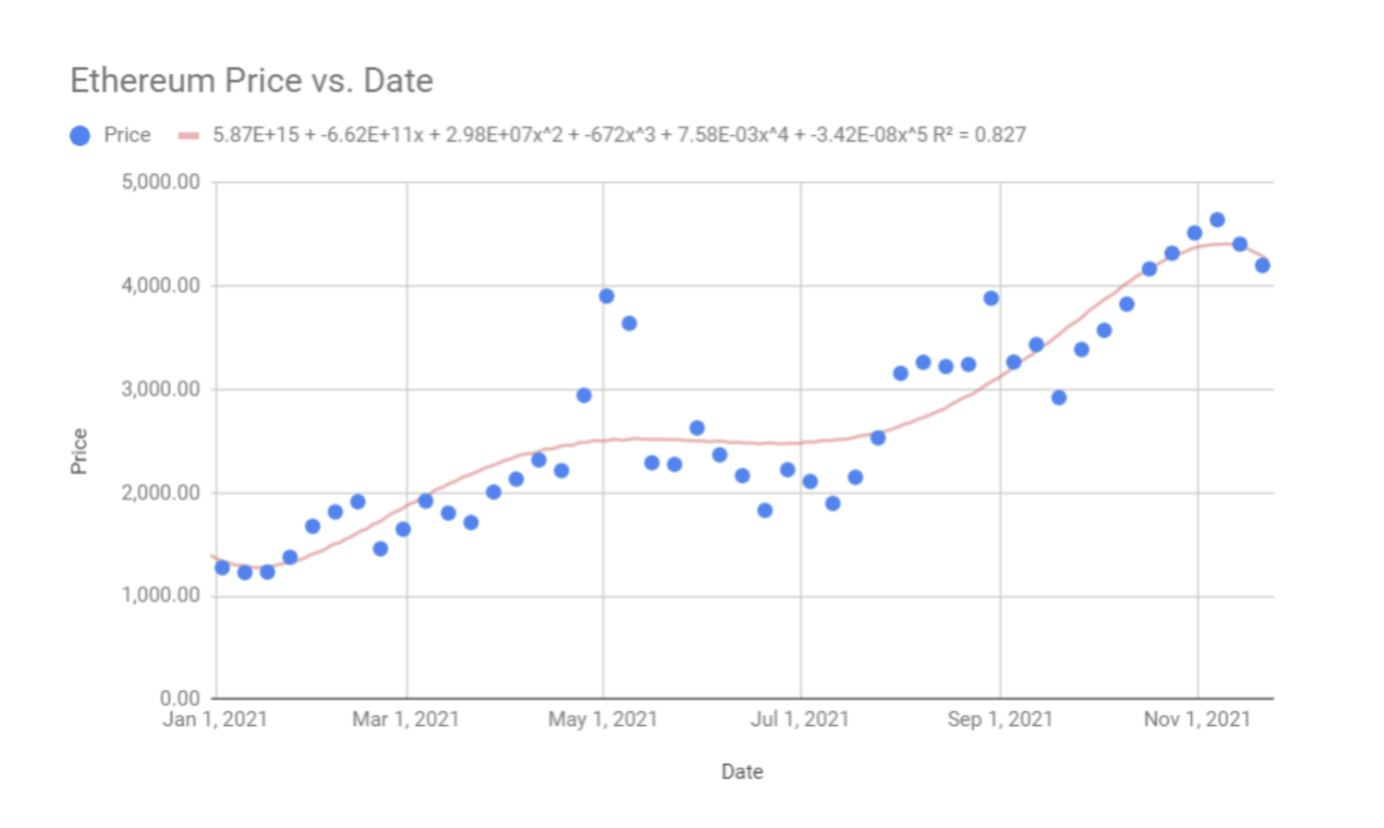
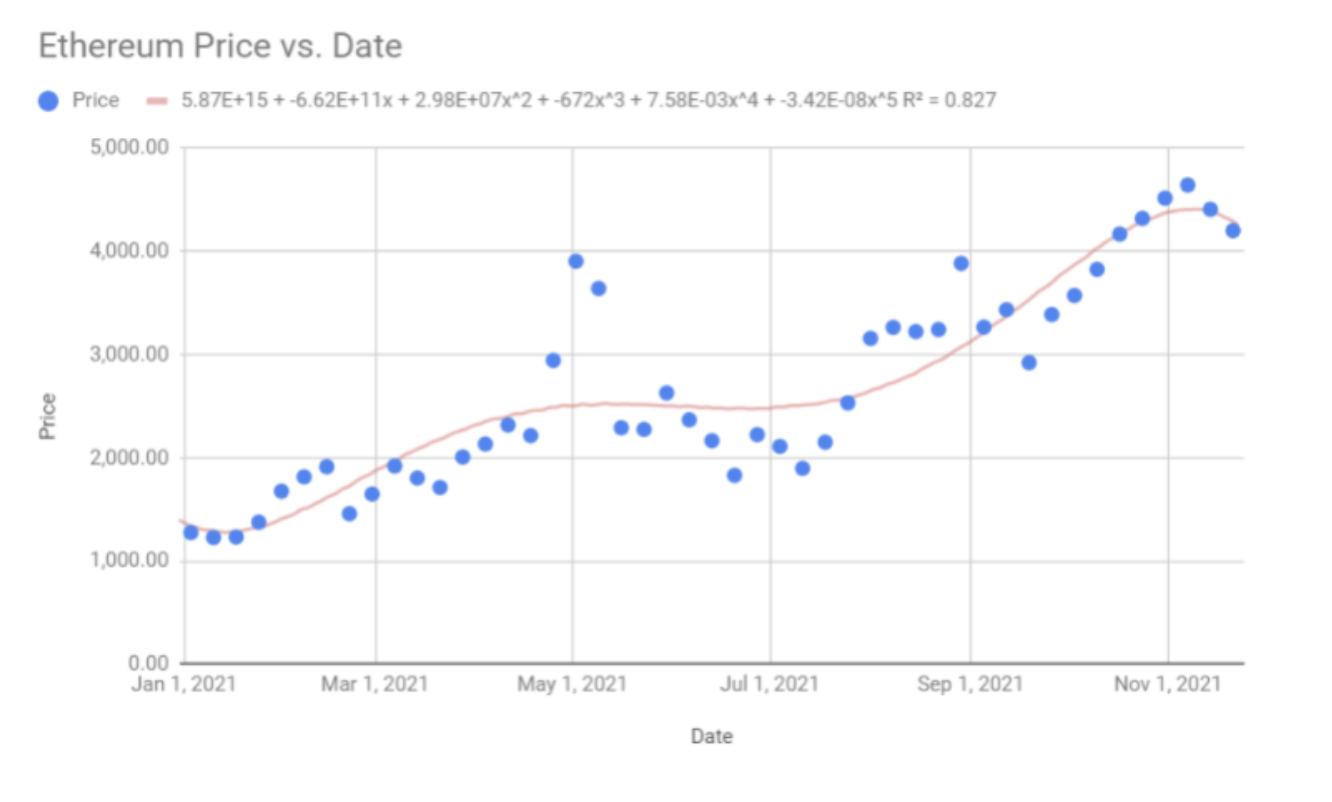
DATA GRAPHED: ETHEREUM PRICE VS DATE ANALYSIS:
The "X" axis represents the ending Ethereum every week from Jan 3, 2021 – Nov 23, 2021. The "Y" represents the end price of one token of Ethereum corresponding to the week.
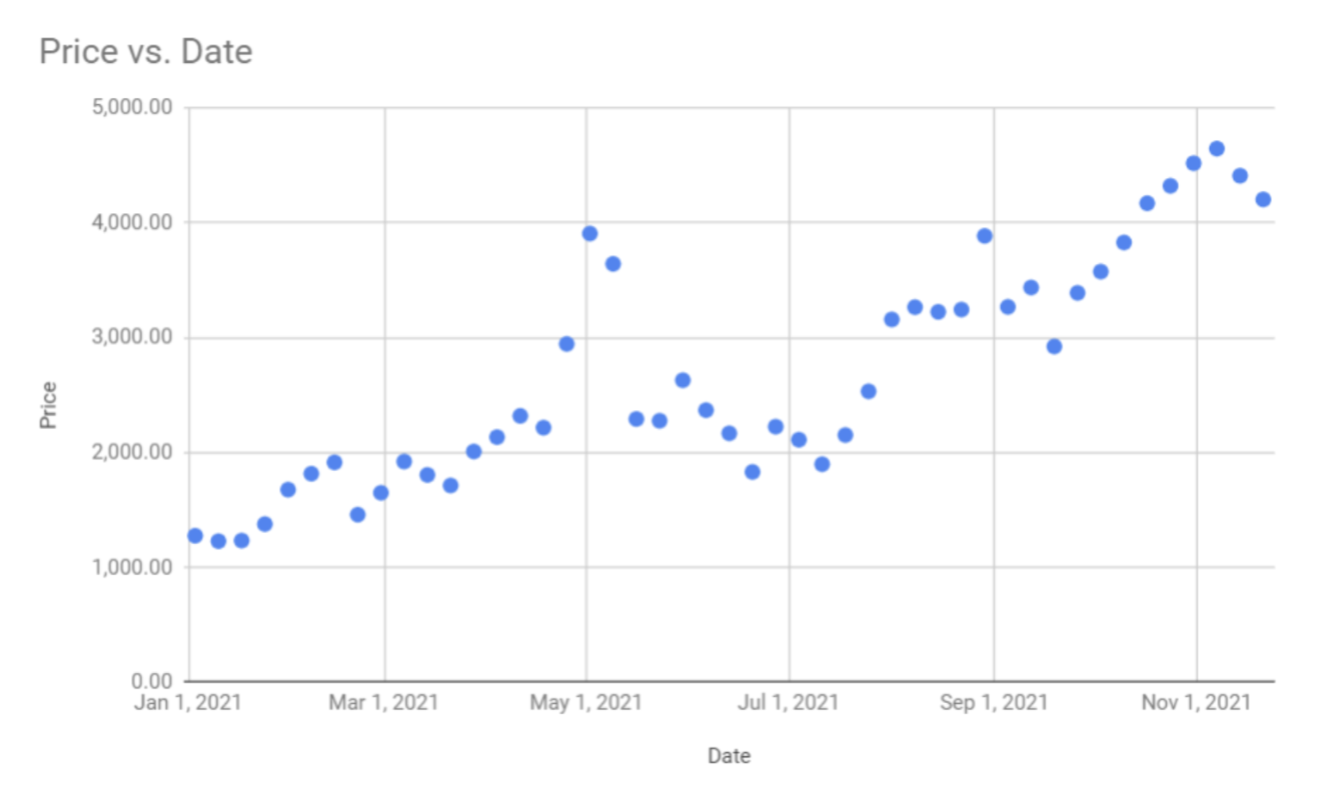
REGRESSION ANALYSIS & THE CURVE OF BEST FIT FOR ETHEREUM PRICE:
Equation: y=5.87E+15 + -6.62E+11x + 2.98E+07x^2 + -672x^3 + 7.58E-03x^4 + -3.42E-08x^5
AVERAGE RATE OF CHANGE OF ETHEREUM:
Interval #1: (18, 3,905.55)
Interval #2: (31, 3,158.00)
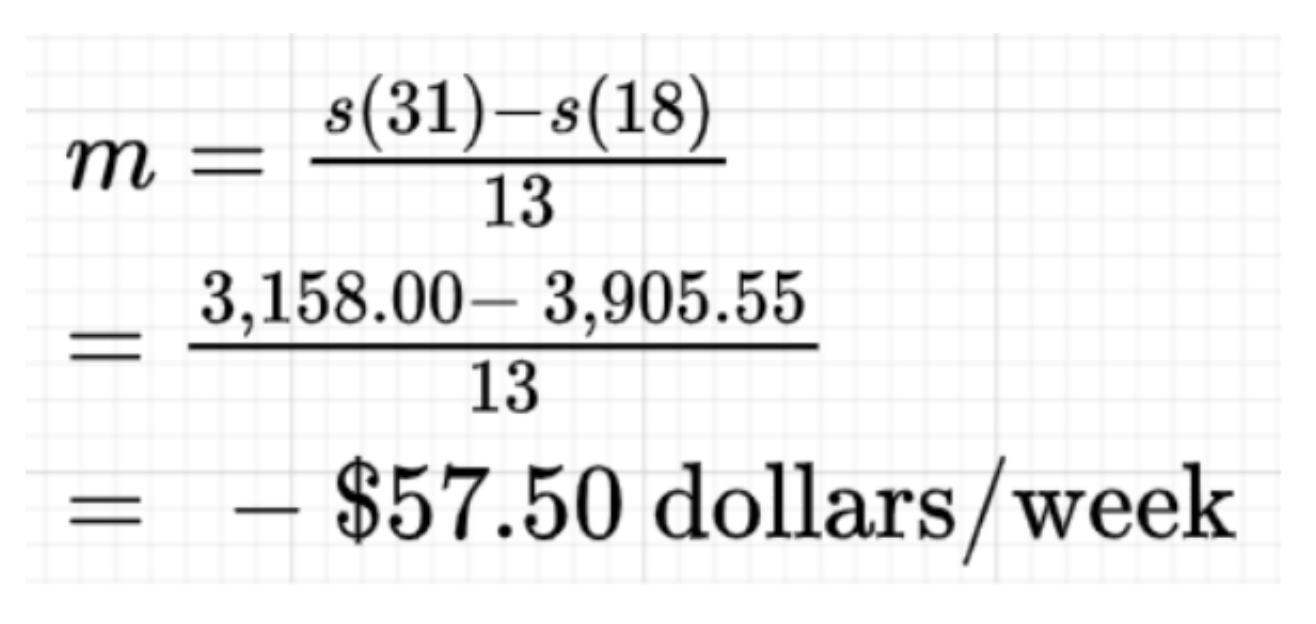
The calculations for the average describe the period of May 02, 2021, to Aug 01, 2021, where the price of Ethereum decreased on average by $57.50 per week. The secant line has a negative slope meaning the price decreased every week over the interval.
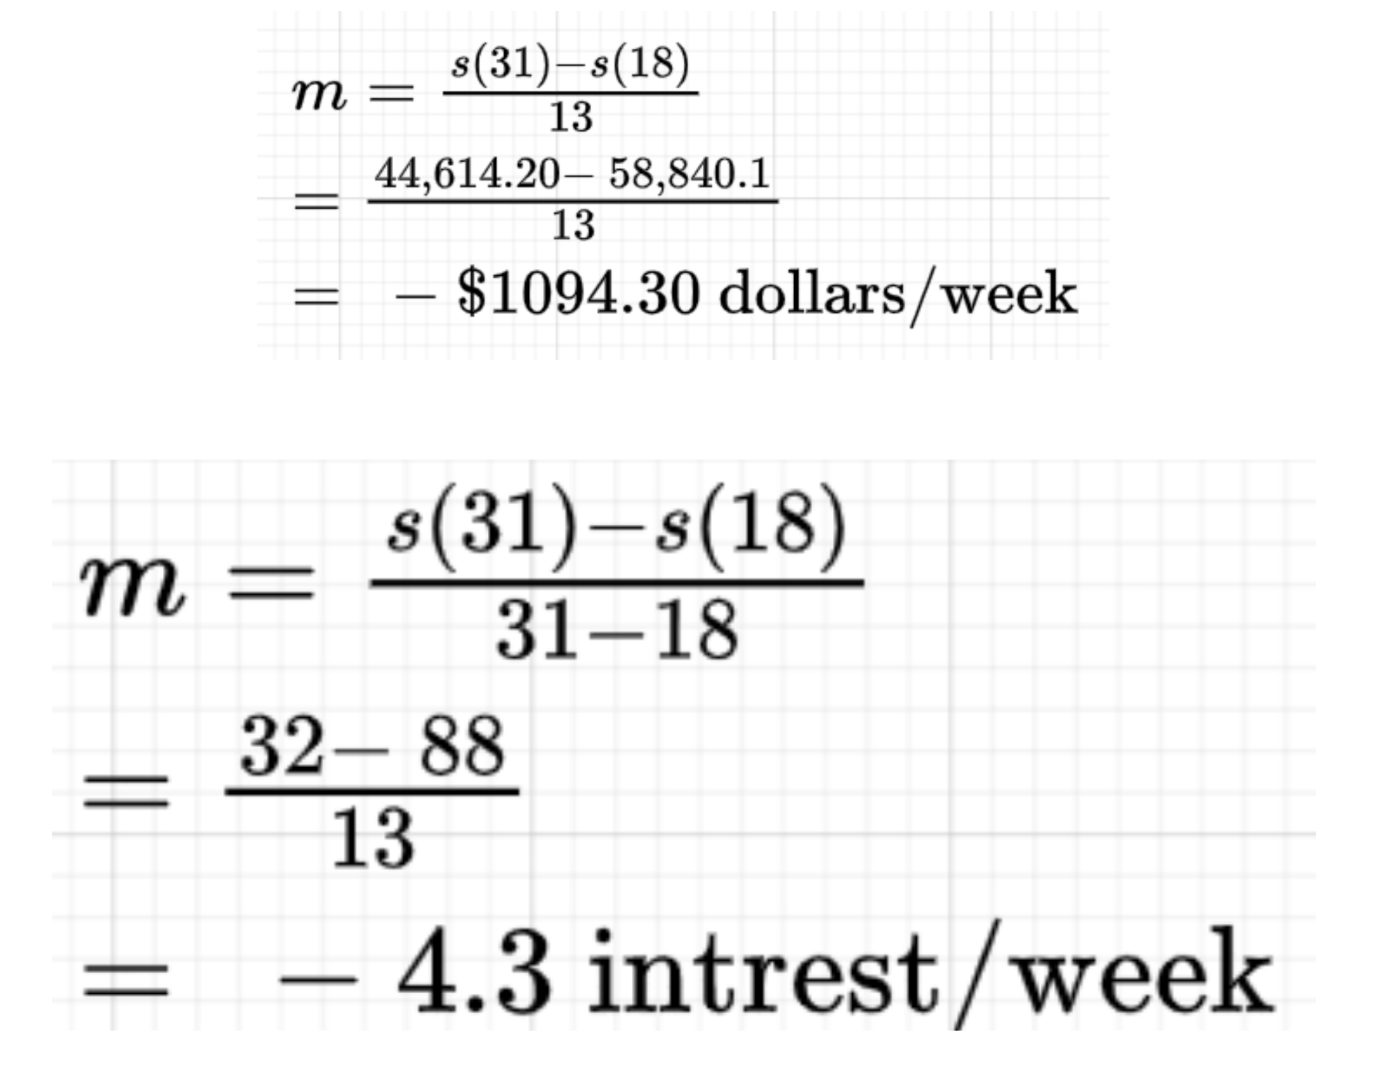
We also see Bitcoin follow the same price trend, substantially falling from a high of 58,840.10 with an average decrease of $1094.30 every week to reach 44,514.20 in August.
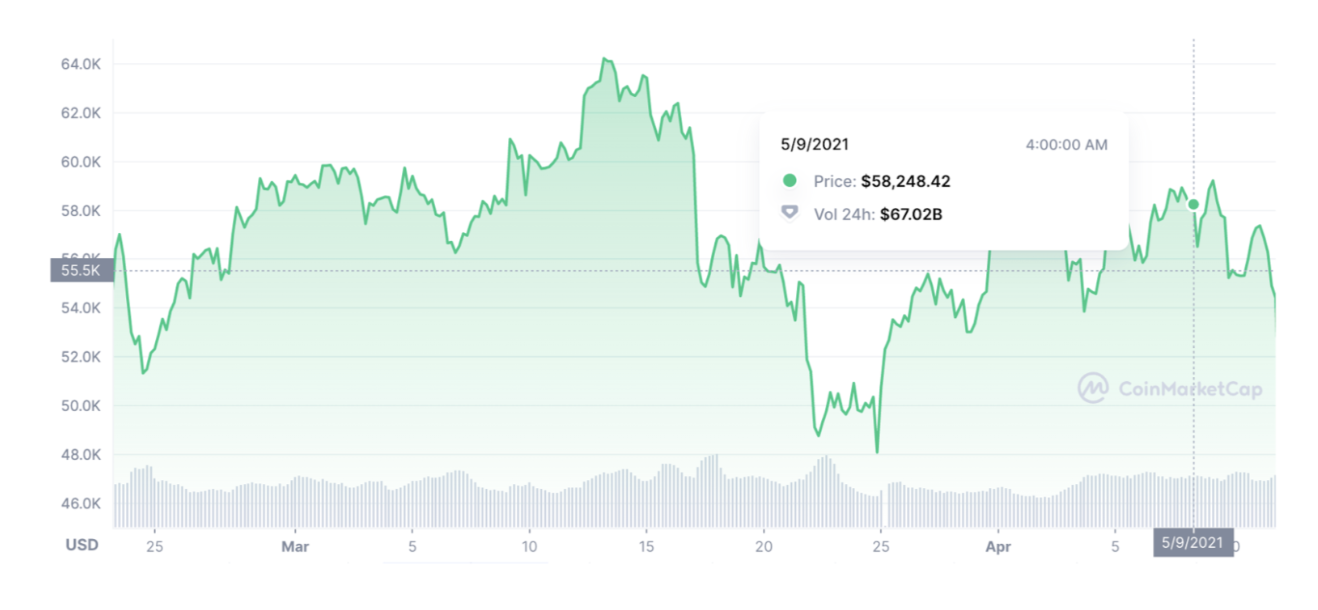
There are several factors that may have influenced this downfall over that period but leading up to the week of May 9, 2021 the dramatic rise came about from bull rally sparked by hedge fund managers, banks and other companies embracing cryptocurrency in direct contrast to what they had said earlier. Alongside Coinbase's IPO and influential parties like Elon promising to buy up to a billion in crypto for Tesla's balance sheets and introduction to purchasing their vehicles through it. But the downfall came in part to the whirlwind of negative headlines sounding cryptocurrencies.
Things such as sizable environmental impact where Tesla CEO Elon Musk pulled back on accepting transactions in bitcoin. Alongside a new round of regulations by the Chinese government, which hit hard on the massive mining sector and a sell which initiated an uproar of volatility and people losing interest in Ethereum. In fact, people significantly started losing interest from its peak in May 9, 2021 at an average rate of 4.4 every week. This then also coincides with the price fall of all currencies and market capitalization from $2,212,387,351,162 USD to $1,661,294,995,335 USD.
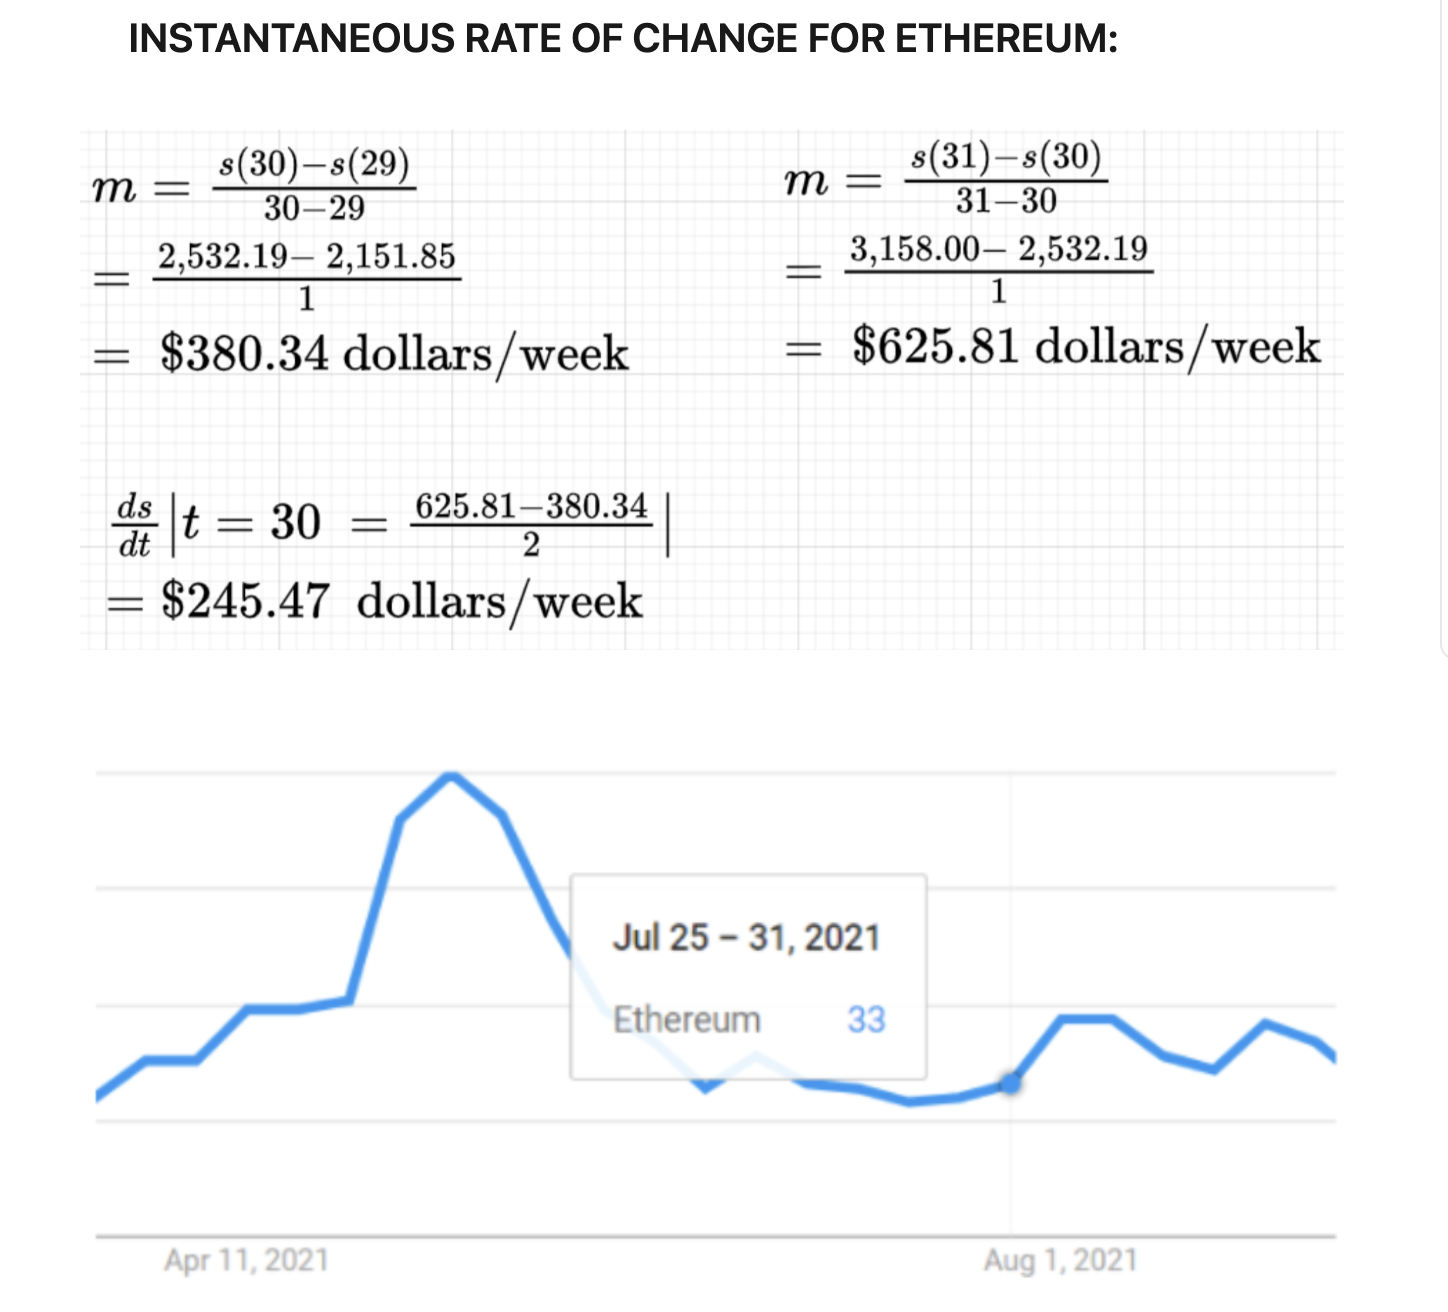
INSTANTANEOUS RATE OF CHANGE FOR ETHEREUM:
To calculate the instantaneous rate of day July 25, 2021, I used a method in which I average the intervals prior to and preceding July 25.The weeks from July 18th to August 1st had been a very "bullish" period for Ethereum climbing an average of $245.47 each week. Amazon confirmed it may be looking to digital currency for its platform, as it posted for a job listing for a digital currency expert for its payments team. Next up Jack Dorsey, Cathie Wood, and Elon Musk talked on the "The B-Word.". Where Elon said Tesla would be accepting bitcoin for vehicle purchases again. This news alongside the short squeeze and investors exiting their short positions advances the price even higher. Therefore moving the overall interest in Ethereum from 33 to 47.
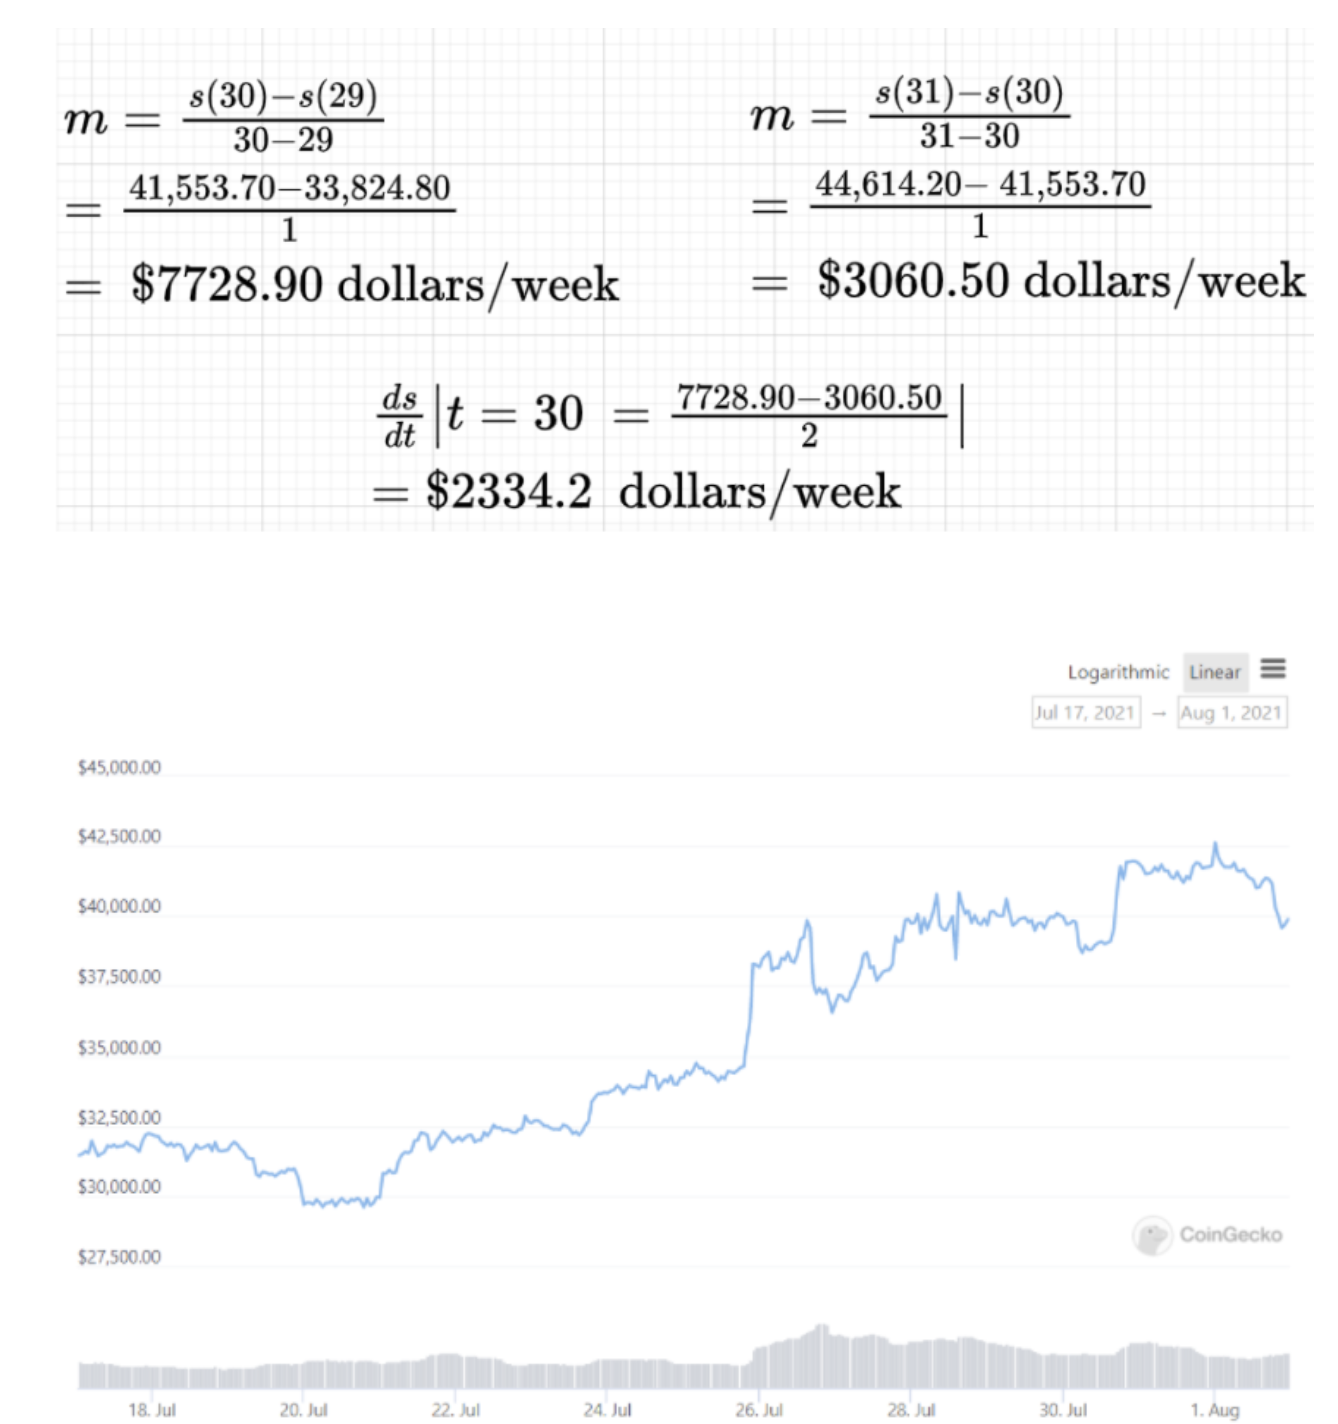
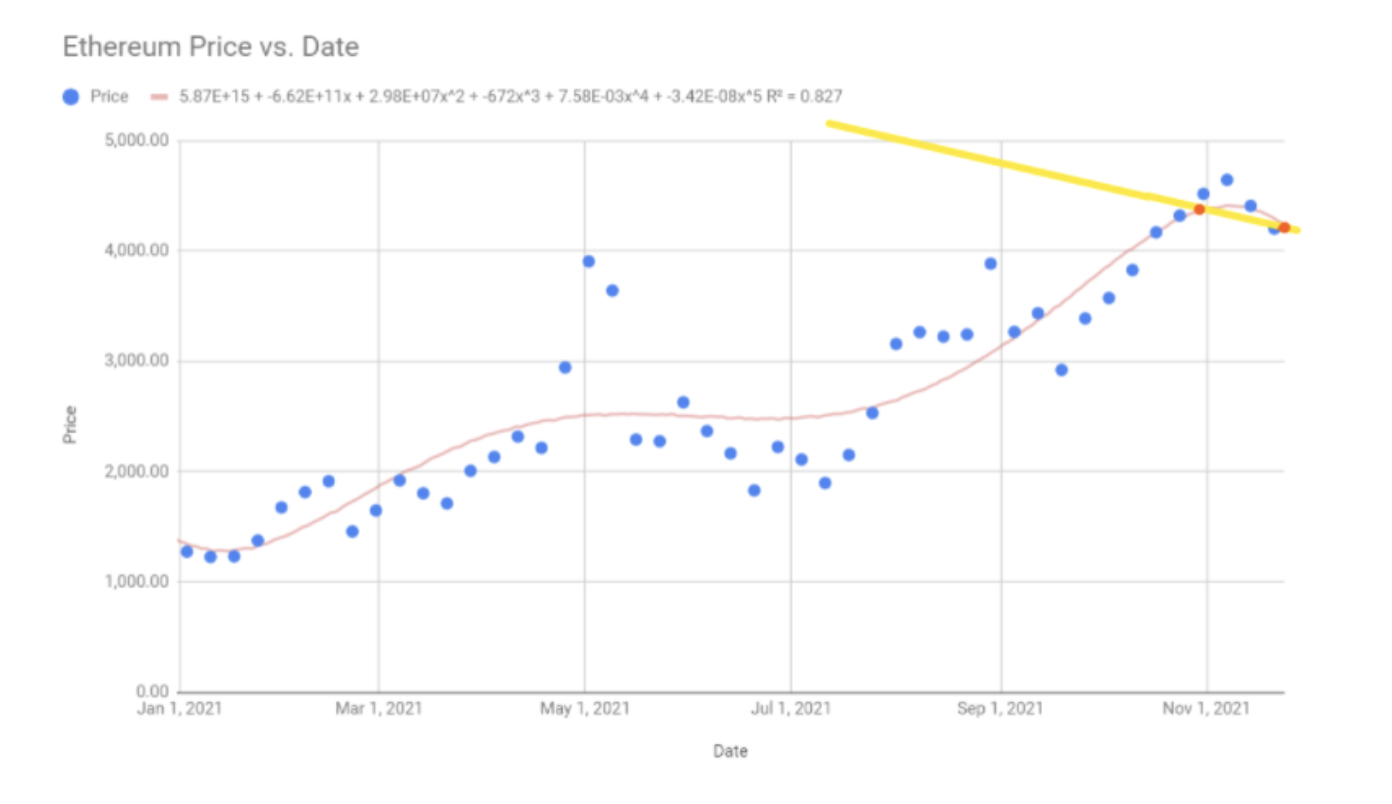
Bitcoin's price also went up significantly from 33,824.80 to a peak of 44,614.20. Looking at the limitation calculations of Bitcoin below it's clear that during this period, it rose an overall $10,790.2 which means 23.94% rise of the period and also 6.89% or $2334.2 increase weekly. Additionally, as shown in the diagram from October 28 to November 18, Ethereum lost approximately $543.46. Using the tangent line the two numbers represented are (Oct 28, 4855.17) (Nov 18, 4311.71) The negative tangent line represents the value of one Ethereum and its decrease in value leading up to Nov 18th.
So we can hypothesize that the price of Ethereum for November 6th is approximately $4,400.This notion holds well because the opening price of Ethereum for November 18th was $4,482.65.This may be due to the fact that NFT trading volume hit $10.7 billion which in turn means people started liquidating their earning after the last bull runs into other assets and investments like NFT. Biden also signed a bipartisan infrastructure bill into law which holds tax reporting guidelines apply to digital assets. Thus inducing people to liquidate their positions.
LIMITATIONS & INTERPRETATION FOR ETH PRICE PREDICTION
Ethereum was first created by a 19-year-old Vitalik Buterin in 2013. Creating it as a first-generation smart contract and decentralized application platform foundation. Basically making it is a digital agreement made using code that sets in place rules that are to be followed by the two parties, making no one party have governance over the agreement, therefore, being decentralized. In 2021 Ethereum has already increased 507.6% from a price of $730 USD to peaking at 4,878.26 Nov 10, 2021.
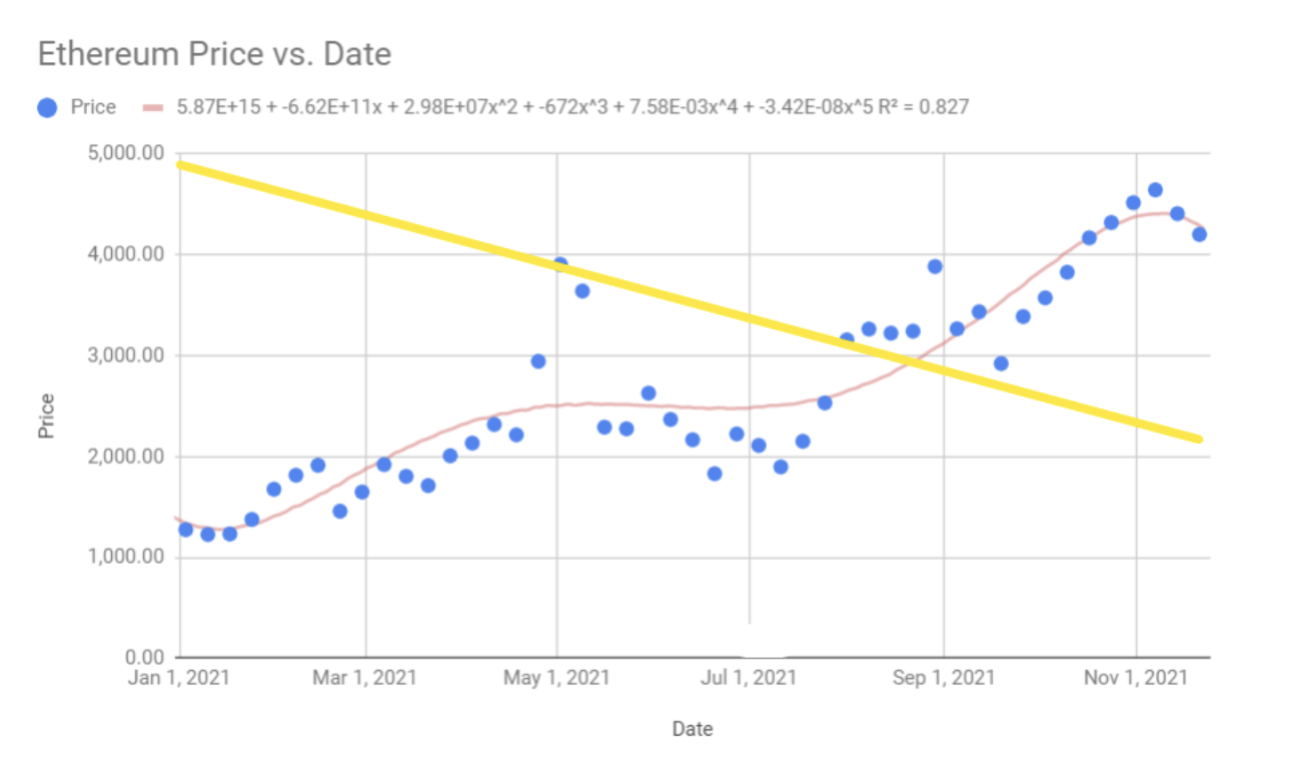
Although we're able to create a good estimation of what the price can be over an instantaneous period when taking a look at the data over a larger period the regression curve looks inconsistent. This is clearly evident in the period of April 25th to May 9th where the value of one Ethereum went up 72.26%. But the week after it came down just as it went up. Just as shown below the curves of best fit fails to denote this event, due to the distribution of the other data being inconsistent with the spike.
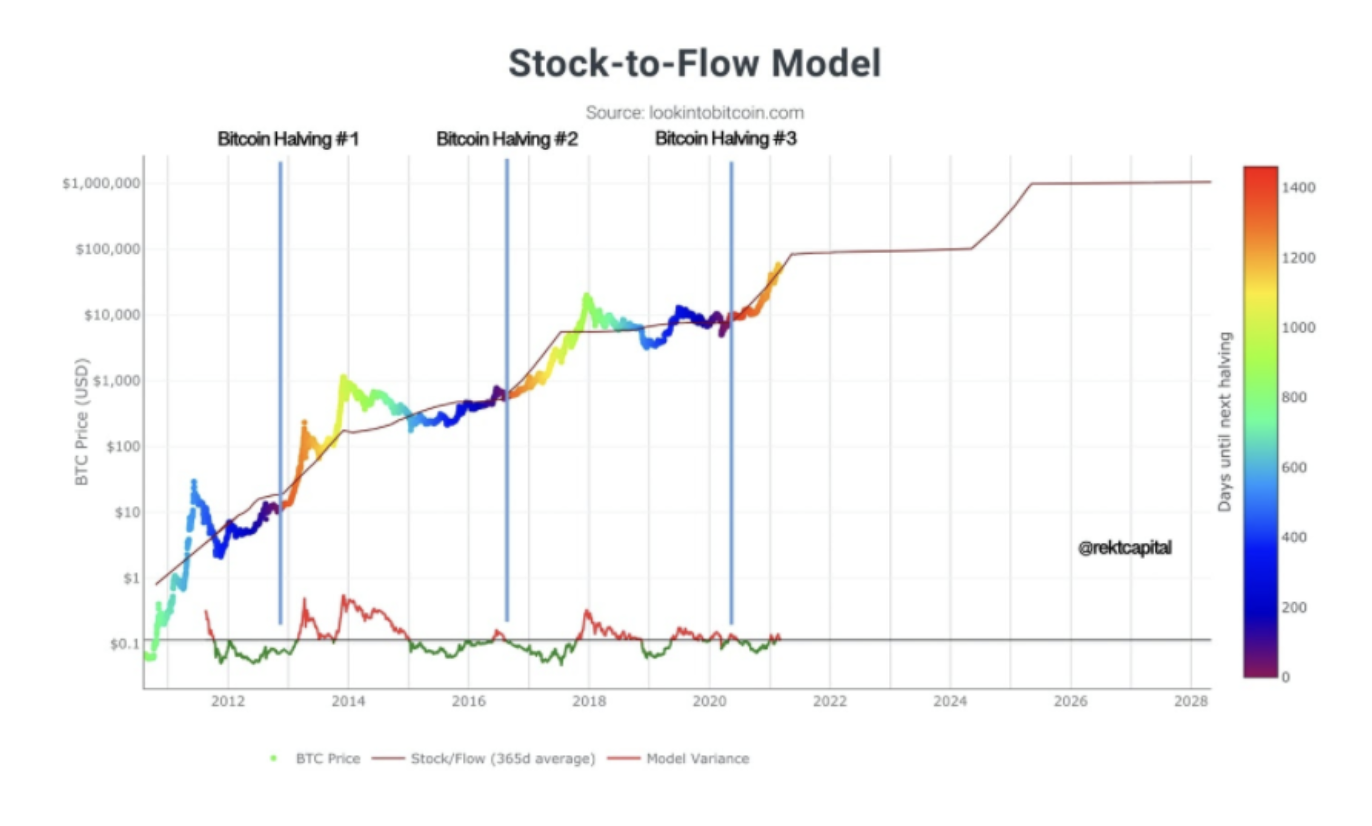
This narrative is much different when compared to Bitcoin. Bitcoins regression curve consistently sticks to the stock to flow model, where at every halving of the coin the supply left to be to be mined decreases and the reward for mining Bitcoin transactions is cut in half, therefore, leading to the value of one token increase. Due to this Phenomenon not being seen in Ethereum, it leads to fewer inconsistent spikes and overvaluing of the currency.
In the same week, the spike happened to Ethereum, the price of Bitcoin stayed consistent while popularity topped. Now becoming a token outlining the overall trends of the market. When events like the mass adoption of DeFi in the nation occur, the overall market shifts upwards and when plans to adopt crypto to purchase bitcoin diminish most of the market is in the red. Although these events happen on the macro, the overall decreasing supply of Bitcoin keeps it consistently moving forward on a larger period with its overall stock-to-flow models and projections.
The data itself doesn't give us a whole picture of what moves the market. To better grasp what are the many factors that discern the health and volatility that follows in the market it's important to understand the indicators that give the general public the overall health of a chain. The number of nodes on a specific chain indicates the devices from all over the world storing a record of the blockchain hence building a decentralized network. The research from Keimyung University identifies approximately 300,000 nodes on the Ethereum network, which is a good indicator of the value of the currency compared to the total market and the current price of the coin. Determining if it's undervalued or overvalued and if there is strong a community backing the success of the project.
The value of Ethereum is determined by its demand, the more buyers the higher the price, just as with more token supply alongside low demand causes the price to tank. These are the main factor affecting Ethereum on a long-term basis, making it possible for developers to create dApps and smart contracts enabling decentralized solutions to real-world problems.
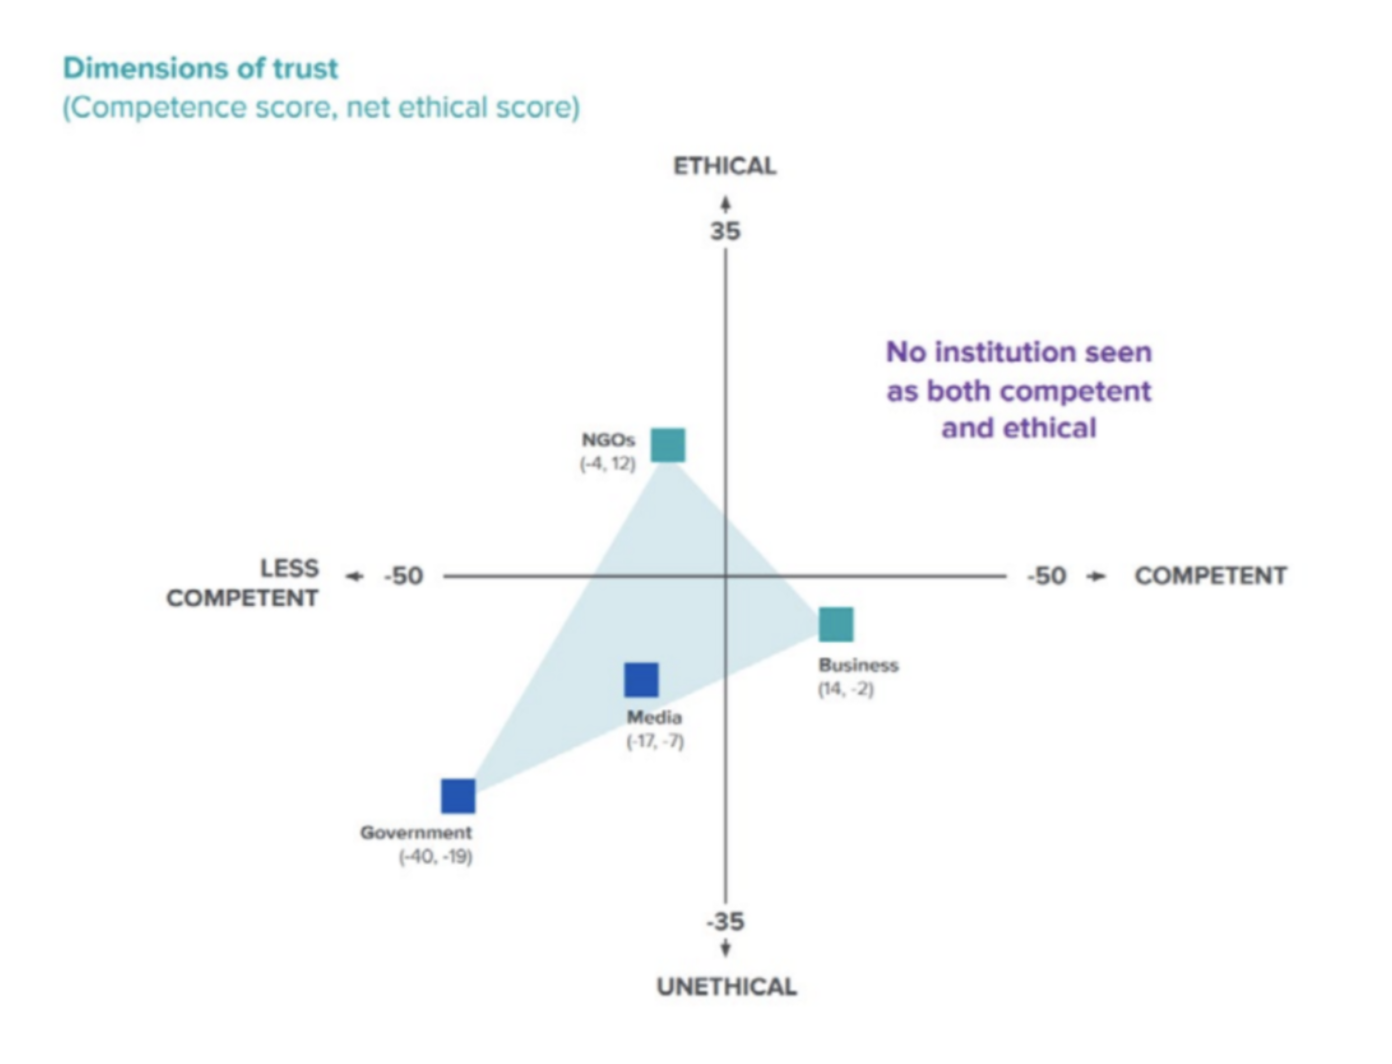
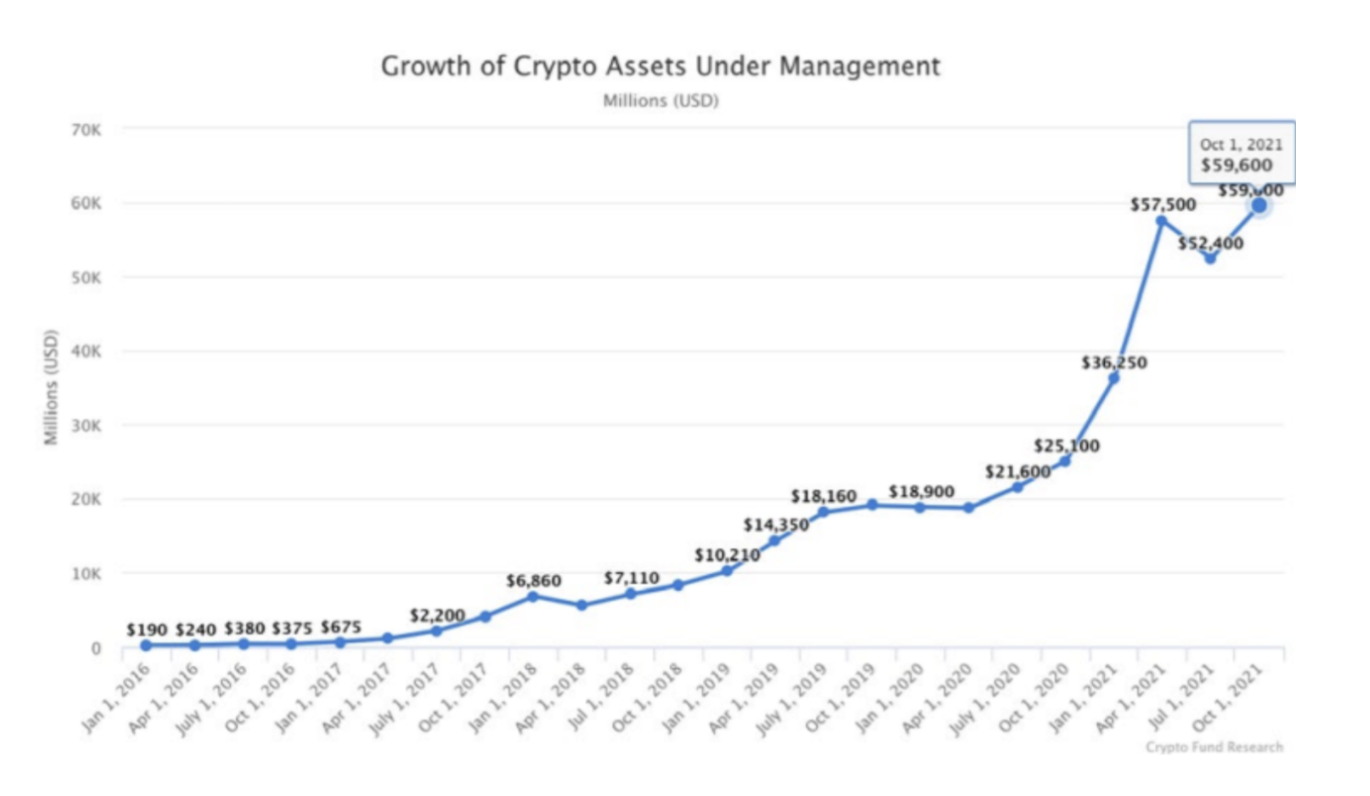
There are several factors that urged the sudden demand for these decentralized solutions, but one of the largest elements came from the collapse of institutional trust. As shown in the diagram above Edelman presents, Business institutes as the most competent and ethical over the other three NGOs, Media and the government. In contrast, the Government and media have been seen as the most incompetent and unethical drive the American population towards the world of cryptocurrencies. Since the U.S. is one of the most influential and biggest globally, it has seen tremendous effects on the global adoption of the technology. Provoking institutional capital to flood into the space, making it move even faster. As shown below in the diagram Crypto dedicated funds have recently seen record capital raises and the sudden appreciation of the fund more firm and group rake their money into it, thereby creating a snowball effect in the ecosystem.
ETHEREUM 2.0 AND ITS IMPACT OF ETHEREUM PRICE IN 2022:
The inflation of a coin has a significant influence on how the market perceives a currency. Ethereum used to be an inflationary coin going up to 4% a year compared to dogecoin’s 3.8%, but on August 5th, 2021, Ethereum had a London Hard fork named EIP-1559. The London Hard Fork/EIP-1559 upgrade is one step towards its larger intentions in order to transition into Ethereum 2.0. This allows Ethereum to become the world’s most deflationary asset without a supply floor. Compared to bitcoin which can only have 21 million to ever exist, Ethereum 2.0 takes a unique route where each transaction results in Ether being burned out of existence. As of Dec 8th $4.4bn has been burned due to the new systems, removing about 233 Ether every hour from supply leading to upward pressure on the price when demand is high.
Additionally, the next phase of Ethereum 2.0 is planned to release in end q1 of 2022, Ethereum plans to scale the network to more than 100,000 transactions/sec far more impressive than its current average of 13. In addition, far more breakthroughs are to be made in regards to security, environmental impact, all through shifting the network from using a proof of work method to a proof of stake consensus model. In this model instead of all the miners fighting to solve the problem first, you put appropriately 32 Eth in collateral in order to be eligible to have that hash assigned to you. In fact, after the launch of Phase 0 of the transition, the Beacon Chain, there has been already 8.5 million ETH been staked valued at more than $36 billion USD. Taking 8.5 million ETH and locking it up as collateral on a contract, decreases the total available supply, therefore, increasing the value of one ether.
HOW TO TAKE ADVANTAGE OF THE SITUATION FOR YOU AND YOUR NFT
What does all of this mean for a person who solely cares about its implication on the NFT market? Well, it means if the market goes down and everyone starts selling, all the millionaires and billionaires and random kids like me are all gonna move their money into NFT. What happens then, we get the snowball effect with more and more investors willing to pay a higher price for that one NFT they think will be worth it. So an NFT like Mutant apes which was once 3.5 eth and which I just was .5 eth from buying. now becomes worth 16 ETH. What are you gonna do about this then, either wait for the next dumb/correction or ape in now!!. Here are a few things I’m doing which might and this is not advice, work for you too:
- Look into NFTs like mine 🙂 or other popular ones which haven’t quite seen their run-up yet or have still a probability of climbing even higher. This is all the stuff in my wallet. Out of those, I believe WOW or World of women has the most probable chances price climbing even higher.
- Just hold, it’s gotta come back up sooner or later. Right?
- Stake that stuff. Provide liquidity or something like that to earn a better rate and grow your positions. I use crypto.com and defi dapps
- Be the first the attack when the NFT market tanks then HODL
CONCLUSION:
In conclusion, It’s undeniable that on a macro level the trust in institutions is at an all-time low. We’ve been in a bullish market for several months now, and there’s no telling where the market is headed. With new innovations coming with Ethereum 2.0 and rapid decoupling of crypto for its own use cases. The overall market seems to want to head towards maturity, but at this point, the market seems to be highly volatile, moving heavily based upon market influences such as individuals, the general public appeal, and its correlation between Bitcoin and other cryptocurrencies.
So it's clear that even if you have the right tool for technical analysis people are unpredictable, predicting the future is a hit or miss but using all the data I've gathered and the plausible outlooks analysts have there are one of two outcomes. I've conceived for Ethereum over the upcoming year. One is the whole market is in a bubble and will explode near the end of q2 2022 and we become stuck in a multi-year bear market in which only the resilient pull through. The market is certainly overvalued right now, where it is at a point in which any sort of alarming news will cause substantial volatility. I'm sure something is gonna happen that brings the market crumbling down. It could possibly be the fact that 98% of the claims some decentralized institutions make are false, possibly with the case of Tether, altcoins or other stable coins. Another outcome we can possibly see happening would be the continuation of our current uphill market leading into 2023, wherein the market corrects itself incrementally, similar to the current state of the stock market. Steadily moving higher into perpetuity. With all the innovation leading this industry forward we can only be “bearish” for this technology, as we hold front-row seats as our society transform into a reality of “meta”
Thanks,
Alex